Electrify Chicago
According to the
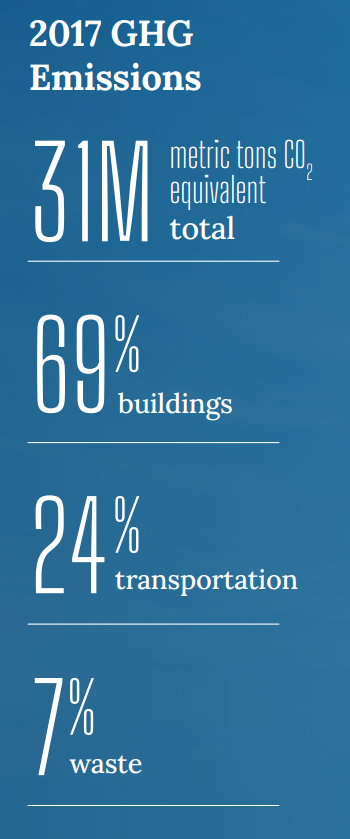
2022 Chicago Climate Action Plan ,
a whopping 69% of Chicago's emissions come from buildings, making it
our biggest challenge and our biggest opportunity as a city to tackle
change. At Electrify Chicago we want to showcase some of the best and worst performing
buildings in the city using publicly available data and manual annotations to add
building photographs and label multi-building owners like universities.
,
a whopping 69% of Chicago's emissions come from buildings, making it
our biggest challenge and our biggest opportunity as a city to tackle
change. At Electrify Chicago we want to showcase some of the best and worst performing
buildings in the city using publicly available data and manual annotations to add
building photographs and label multi-building owners like universities.
You can start by looking at Chicago's buildings with the highest greenhouse gas intensity - this means that they use the most energy when adjusted per unit of square foot, so big buildings could actually perform much better than very inefficient small buildings on this metric.
Chicago Buildings by Greenhouse Gas Intensity
Note: Data only includes large Chicago buildings from 2020
Note: This data only includes buildings whose emissions are reported
under the
Chicago Energy Benchmarking Ordinance. According to the City “As of 2016,
this list includes all commercial, institutional, and residential buildings larger than
50,000 square feet.” This dataset is also then filtered to only buildings with
reported emissions > 1,000 metric tons CO2 equivalent.
This data is also from 2020, but when new benchmark data is available, we'll update the site.
| Property Name / address | Primary Property Type |
Greenhouse Gas Intensity (kg CO2 eq./sqft) |
Total Greenhouse Emissions (metric tons CO2 eq.) |
|---|---|---|---|
|
The Monroe Building
104 S Michigan Ave
| Office | 7.1 kg/sqft
Lowest 40%
| 1,718 tons
Lowest 39%
|
|
Catalyst
123 N Desplaines St
| Multifamily Housing | 7.1 kg/sqft
Lowest 40%
| 1,812 tons
Lowest 42%
|
|
Mather HS -CPS
5835 N Lincoln Ave
| K-12 School | 7.1 kg/sqft
Lowest 40%
| 1,318 tons
Lowest 20%
|
|
1140 S Wabash Ave
1140 S Wabash Ave
| Multifamily Housing | 7.1 kg/sqft
Lowest 40%
| 2,101 tons
Highest 48%
|
|
111 E Chestnut Condominium Association
111 E Chestnut St
| Multifamily Housing | 7.1 kg/sqft
Lowest 40%
| 4,176 tons
Highest 20%
|
|
(IL279) - 212 W Washington Condo
212 W Washington St
| Multifamily Housing | 7.1 kg/sqft
Lowest 40%
| 1,964 tons
Lowest 47%
|
|
Beach Point Tower Condominium Association
5801 N Sheridan Rd
| Multifamily Housing | 7.1 kg/sqft
Lowest 40%
| 1,131 tons
Lowest 9%
|
|
833 W BUENA AVE
833 W BUENA AVE
| Multifamily Housing | 7.1 kg/sqft
Lowest 40%
| 1,317 tons
Lowest 20%
|
|
6200-42 N Hoyne Ave
🏆
6200-42 N Hoyne Ave
| Multifamily Housing | 7.1 kg/sqft
Lowest 40%
| 1,172 tons
Lowest 13%
|
|
Mary Hartwell Catherwood Apts
3920 - 3940 N Clark St
| Multifamily Housing | 7.1 kg/sqft
Lowest 40%
| 1,713 tons
Lowest 38%
|
|
360 N Michigan Ave
360 N Michigan Ave
| Hotel | 7.1 kg/sqft
Lowest 40%
| 2,790 tons
Highest 33%
|
|
4640 N SHERIDAN RD
4640 N SHERIDAN RD
| Multifamily Housing | 7.1 kg/sqft
Lowest 40%
| 1,539 tons
Lowest 31%
|
|
1300 Lake Shore Drive Condominium Association
1300 N Lake Shore Dr
| Multifamily Housing | 7.1 kg/sqft
Lowest 40%
| 2,586 tons
Highest 37%
|
|
535 North Michigan
535 N Michigan Ave
| Multifamily Housing | 7.1 kg/sqft
Lowest 40%
| 3,180 tons
Highest 28%
|
|
Adler Place
1629 S Prairie Ave
| Multifamily Housing | 7.1 kg/sqft
Lowest 40%
| 2,718 tons
Highest 34%
|
Data Source:
Chicago Energy Benchmarking Data