Electrify Chicago
According to the
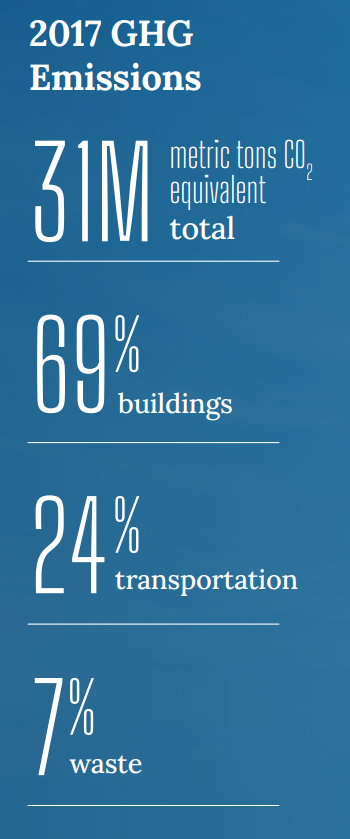
2022 Chicago Climate Action Plan ,
a whopping 69% of Chicago's emissions come from buildings, making it
our biggest challenge and our biggest opportunity as a city to tackle
change. At Electrify Chicago we want to showcase some of the best and worst performing
buildings in the city using publicly available data and manual annotations to add
building photographs and label multi-building owners like universities.
,
a whopping 69% of Chicago's emissions come from buildings, making it
our biggest challenge and our biggest opportunity as a city to tackle
change. At Electrify Chicago we want to showcase some of the best and worst performing
buildings in the city using publicly available data and manual annotations to add
building photographs and label multi-building owners like universities.
You can start by looking at Chicago's buildings with the highest greenhouse gas intensity - this means that they use the most energy when adjusted per unit of square foot, so big buildings could actually perform much better than very inefficient small buildings on this metric.
Chicago Buildings by Greenhouse Gas Intensity
Note: Data only includes large Chicago buildings from 2020
Note: This data only includes buildings whose emissions are reported
under the
Chicago Energy Benchmarking Ordinance. According to the City “As of 2016,
this list includes all commercial, institutional, and residential buildings larger than
50,000 square feet.” This dataset is also then filtered to only buildings with
reported emissions > 1,000 metric tons CO2 equivalent.
This data is also from 2020, but when new benchmark data is available, we'll update the site.
| Property Name / address | Primary Property Type |
Greenhouse Gas Intensity (kg CO2 eq./sqft) |
Total Greenhouse Emissions (metric tons CO2 eq.) |
|---|---|---|---|
|
The Pierre Condominium
2100 N Lincoln Park West
| Multifamily Housing | 6.0 kg/sqft
Lowest 19%
| 1,140 tons
Lowest 10%
|
|
The Caravel
635 N Dearborn St
| Multifamily Housing | 6.0 kg/sqft
Lowest 19%
| 1,266 tons
Lowest 18%
|
|
525 Hawthorne Place Condominium Association
525 W Hawthorne Pl
| Multifamily Housing | 6.0 kg/sqft
Lowest 19%
| 1,645 tons
Lowest 35%
|
|
720 W. Gordon Terrace CA
720 W Gordon Ter
| Multifamily Housing | 6.0 kg/sqft
Lowest 19%
| 1,736 tons
Lowest 40%
|
|
One Place Condominium Association
1 E 8th St
| Multifamily Housing | 6.0 kg/sqft
Lowest 19%
| 1,863 tons
Lowest 44%
|
|
Daley
7500 S Pulaski Ave
| College/University | 6.0 kg/sqft
Lowest 19%
| 2,999 tons
Highest 30%
|
|
Lidia Puchinska Apartments
838 N Noble St
| Multifamily Housing | 6.0 kg/sqft
Lowest 19%
| 1,624 tons
Lowest 34%
|
|
777 North Michigan Condo Association
777 N Michigan Ave
| Multifamily Housing | 6.0 kg/sqft
Lowest 19%
| 2,346 tons
Highest 42%
|
|
Museum Pointe CA
233 E 13th St
| Multifamily Housing | 6.0 kg/sqft
Lowest 19%
| 2,423 tons
Highest 40%
|
|
250 270 Pearson
250 270 E Pearson St
| Multifamily Housing | 6.0 kg/sqft
Lowest 19%
| 3,702 tons
Highest 24%
|
|
Metropolitan Tower Condo Association
310 S Michigan Ave
| Multifamily Housing | 6.0 kg/sqft
Lowest 19%
| 3,486 tons
Highest 25%
|
|
180 N LaSalle St
180 N LaSalle St
| Office | 6.0 kg/sqft
Lowest 19%
| 5,125 tons
Highest 15%
|
|
The Chandler at Lakeshore East
450 E Waterside Dr
| Multifamily Housing | 6.0 kg/sqft
Lowest 19%
| 2,538 tons
Highest 38%
|
|
Lake Park Plaza Condominium Association
3930 N Pine Grove Ave
| Multifamily Housing | 6.0 kg/sqft
Lowest 19%
| 3,100 tons
Highest 29%
|
|
IL0303ZZ - Metcalf Federal Bldg
77 W Jackson
| Office | 5.9 kg/sqft
Lowest 18%
| 4,863 tons
Highest 16%
|
Data Source:
Chicago Energy Benchmarking Data